By Vision Times contributor Fan Jianzhong
It is widely acknowledged that the official economic data released by the Chinese Communist Party (CCP) is unreliable. Not only do external observers doubt it, but even the Chinese citizens themselves and the CCP harbor skepticism.
However, here lies the question: If the officially published numbers are fabricated, what is the actual economic data? Can we estimate more reliable figures using alternative data sources?
This issue has been widely discussed for over two decades. Thomas Rawski, an economic historian at the University of Pittsburgh, published a paper in 2001 examining the inconsistency in China’s overall economic statistics. He discovered that between 1997 and 2001, while the CCP reported a 34.5% growth rate in Gross Domestic Product (GDP), energy consumption during the same period decreased by 5.5%, inflation dropped by 2.3%, and urban employment hardly increased. Such contradictions have never been observed in the economic development history of other East Asian countries. His estimation suggests that China’s true GDP growth rate during this period would not exceed one-third of the official claim and is likely even lower.
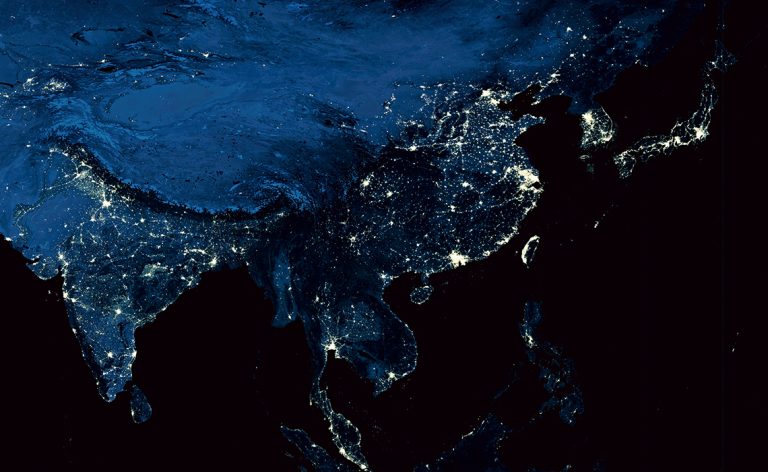
Nighttime satellite imagery
Following Rawski’s groundbreaking paper, hundreds of studies have delved into the true state of China’s Gross Domestic Product (GDP). Recently, a highly persuasive piece of evidence emerged in the prestigious economics journal Journal of Political Economy. The findings of this study indicate that China’s GDP in 2013 was at most half of what the Chinese Communist Party (CCP) claimed.
Success
You are now signed up for our newsletter
Success
Check your email to complete sign up
The author of this research is Professor Luis Martinez, a young scholar from the University of Chicago’s Harris School of Public Policy. The uniqueness of this study lies in its use of 20 years of global nighttime satellite imagery data from 1993 to 2013. The brightness observed in these satellite images can roughly reflect the level of economic activity in a given region. Based on historical trends, there is a strong positive correlation between the growth rate of satellite image brightness and economic growth.
Martinez employed the Freedom House’s freedom index to classify each country into three categories: free, partly free, and authoritarian. Between 1993 and 2013, most countries experienced significant GDP growth, and the brightness of nighttime satellite imagery also increased notably. However, a peculiar discrepancy emerged: authoritarian countries reported much higher GDP growth rates than their corresponding nighttime brightness growth rates, far exceeding the differences observed in free countries.
In Figure 1, the horizontal axis represents the growth rate of nighttime brightness over those 20 years, while the vertical axis displays GDP growth rates. The circular markers represent free countries, showing a clear positive correlation between the two growth rates with a slope of approximately 0.033. The triangular markers represent authoritarian countries, where the correlation between the two growth rates is even more pronounced, with a slope of approximately 0.06, nearly double that of free countries. Notably, Martinez’s data highlights China as one of the countries with the largest disparities between these two indicators.
Possible explanations
One potential explanation is that authoritarian countries, despite experiencing high economic growth, may conserve electricity by using fewer lights at night. However, we observe that Western countries, including Europe and the United States, often have less vibrant “nightlife.” Workers tend to finish their shifts earlier, and stores close earlier. Conversely, many less free countries, such as China and Vietnam, exhibit frequent nighttime activity, resulting in well-lit streets. Therefore, this explanation seems unlikely.
Another interpretation is that authoritarian countries generally have lower income levels, leading to a stronger correlation between nighttime brightness growth rates and economic growth rates. However, even after controlling for various national characteristics in regression analysis, Martinez found that the gap between the two growth rates remains larger in authoritarian countries than in democratic ones. This suggests that national characteristics alone do not account for the differences between these two types of countries.
Data falsification
The discrepancy between growth rates in authoritarian countries, as highlighted by the author, primarily stems from the Chinese Communist Party (CCP) inflating its economic growth figures.
In theory, authoritarian governments have a motive to exaggerate economic performance. Since their legitimacy doesn’t derive from democratic elections, they rely on strong economic performance to bolster their authority. Additionally, the lack of oversight in authoritarian regimes provides ample opportunity for data manipulation.
Turning to empirical evidence, Martinez presents several compelling points. For instance, he observes the changes in countries that transitioned from democracies to authoritarian regimes, as depicted in Figure 2. Prior to the regime shift, the gap between nighttime brightness growth rates and economic growth rates remained relatively stable. However, after becoming authoritarian, this gap widened significantly.
Furthermore, Martinez discovers that during global economic upturns, authoritarian countries’ GDP growth rates align more closely with nighttime brightness growth rates. Conversely, during economic downturns, the disparity between the two widens. This phenomenon likely occurs because authoritarian governments feel compelled to embellish economic data during tough times.
Additionally, GDP comprises four components: consumption, investment, government spending, and net exports (exports minus imports). While trade data can be cross-verified from foreign sources, consumption data is also easily comparable. Consequently, investment and government spending become the areas where authoritarian regimes can more readily manipulate figures without detection. Martinez indeed finds that investment and government spending are the most significantly inflated components.
Chinese anomaly
According to Martinez’s data, China stands as the second-largest country where GDP growth exceeds nighttime brightness growth, trailing only Ethiopia.
His estimations reveal that between 1992 and 2013, China’s officially claimed GDP logarithmic difference was 1.95. However, after adjusting for nighttime brightness, the logarithmic difference reduced to 1.2. If the GDP data from 1992 were accurate, a simple calculation suggests that China’s actual GDP in 2013 would be a staggering 49.7% of the official claim.
While we’ve long heard about the unreliability of the Chinese Communist Party’s (CCP) economic data, directly inflating real GDP to twice its value still leaves me astounded. Clearly, the CCP’s actions have veered far beyond the norms of ordinary human behavior. Despite our mental preparation, we tend to underestimate the CCP’s capacity for deception.
The author, Dr. Fan Jianzhong, a professor in the Department of Economics at National Taiwan University, specializes in applied microeconomics, household economics, labor economics, and evaluating public policy effects.
Reference:
Thomas G. Rawski, 2001. “What is happening to China’s GDP statistics?” China Economic Review 12: 347-354.
Luis R. Martínez, 2022. “How Much Should We Trust the Dictator’s GDP Growth Estimates?,” Journal of Political Economy 130(10): 2731-2769.