In 2023, China’s international balance of payments recorded a deficit for the first time in five years, shifting from a net inflow of US$76.3 billion in 2022 to a net outflow of $68.7 billion in 2023.
According to the data from the “Bank Customer Payment Data Time Series” updated by China’s State Administration of Foreign Exchange last week, after reaching a historical peak in 2021 with a net inflow, the net inflow shrank for two consecutive years, turning into a net outflow in 2023, making it the first year of net capital outflow since 2019.
China has experienced net outflows before, notably in the years between 2015 and 2018.
Starting in 2015, China experienced four years of a current account deficit, that is, a net outflow of capital. In 2015, the outflow was $194 billion, reaching its peak in 2016 at $305.3 billion. It was not until 2019 that China restored a net inflow of capital.
READ MORE
- The Collapse of Evergrande: A Symbol of China’s Deepening Property Crisis, Flailing Economy
- Hong Kong Feels the Impact as Foreign Investors Vacate China
- China Mulls $139 Billion ‘Special Debt Issuance’ to Stimulate Economy, Long-Term Growth
From 2015 to 2018, China’s net capital outflow was a result of the rapid decline of China’s economy from double-digit annual growth before 2010 to below 7% after 2015. The situation was exacerbated by the U.S.-China trade war initiated by then-President Donald Trump in mid-2018.
Success
You are now signed up for our newsletter
Success
Check your email to complete sign up
The “Bank Customer Payment Data Time Series” monthly compiled by China’s State Administration of Foreign Exchange records data on enterprise and household transactions, including current accounts such as goods trade, service trade, first-time and second-time income, as well as capital and financial accounts such as direct investment, securities investment, and other investments related to overseas transactions. This table is the most authoritative channel for observing fund inflows and outflows in China’s international balance of payments.
Channels of capital outflow in 2023
Examining the trend over the past five years, first-time income and second-time income (returns on direct investment) have shown an accelerating outflow trend. From a net outflow of $148.1 billion in 2019, it steadily expanded to a net outflow of $249 billion in 2023.
Securities investment and other investments began to show a net outflow from as early as 2022. In 2022, they had a net outflow of $191.8 billion and $29.8 billion, respectively. In 2023, they continued to have a net outflow of $17.2 billion and $21.8 billion, with a slowing pace.
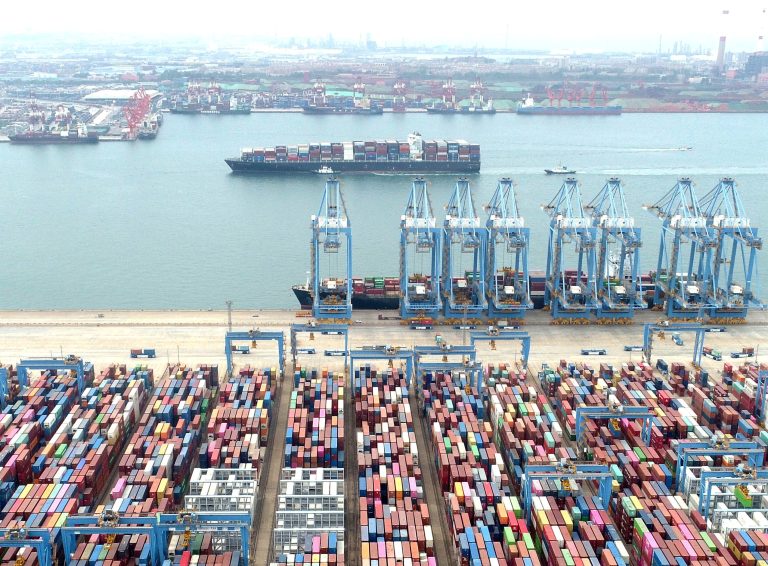
While goods trade consistently had a net inflow, the foreign exchange-calibrated surplus of goods trade shrank from $477.4 billion in 2022 to $408.3 billion in 2023, a decrease of 14.5%. Service trade consistently demonstrated a deficit, that is, a net outflow, which narrowed year by year. In 2023, it expanded again to a net outflow of $103.8 billion, 2.3 times the outflow amount in 2022.
- Trump vs. Biden: How the 2024 Election Will Affect Energy, Tech Giants, and the Automotive Industry
- Kim Jong Un Publicly Suggests Failure of North Korea’s Rationing System
Analyzing the net capital outflow in 2023, it may be seen that compared to 2022, China’s international balance sheet’s net income decreased by $145 billion. The most significant impact was on direct investment, with a net income reduced by $151.6 billion compared to 2022, followed by net income from goods trade and service trade, which decreased by $69.1 billion and $59 billion compared to 2022, respectively. First-time and second-time net income decreased by $29.5 billion compared to 2022. Contrary to the perception that securities investment flowed out the most, it actually decreased by $174.6 billion compared to 2022.
In 2023, direct investment had a net outflow of $118.5 billion, a decrease of $151.6 billion compared to 2022. The main factors were Western investors diversifying their investments and multinational companies implementing nearshore outsourcing and offshore outsourcing in their production chains, shifting their production chains to regions such as Southeast Asia, India, Mexico, or Eastern Europe.
As most Chinese manufacturing occupies the lower tiers of the production chain, Chinese companies were compelled to follow the regional shift in production chains by multinational corporations to ensure orders, contributing to an increase in the outflow of capital. Many Chinese firms ended up relocating production to other countries.
Data from the Ministry of Commerce also shows that in 2023, the actual utilization of foreign capital nationwide was $1.1339 trillion, a year-on-year decrease of 8.0%. The actual utilization of foreign capital in the manufacturing industry was $317.9 billion, a decrease of 1.8%, and in the service industry, it was $776.1 billion, a decrease of 13.4%.
Ten years ago, in 2015 and 2016, China’s net outflow of direct investment was $33 billion and $105.5 billion, respectively. The net outflow in 2023 reached a historical high of $118.5 billion.
The net outflow of service trade, which is a deficit, suddenly expanded from $44.8 billion in 2022 to $103.8 billion in 2023. The main reason is that after the pandemic control measures were lifted, China’s spending on services abroad increased significantly, while service exports decreased significantly.
Historically, China’s rapid economic growth period also marked the peak of net capital inflows. When the scale of net capital inflows shrinks, it often leads to a slowdown in China’s economic growth and a depreciation of the renminbi against the U.S. dollar.
In 2022, China’s current account surplus narrowed from $356.4 billion in the previous year to $76.3 billion. GDP growth slowed from 8.1% in the previous year to 3%, and the renminbi-to-U.S. dollar average exchange rate fell by 4.3% from the previous year. In 2023, the international balance shifted from a surplus of $76.3 billion in the previous year to a deficit of $68.7 billion. GDP growth increased by 5.2% after adjusting the base figure by 0.45%, and the renminbi-to-U.S. dollar average exchange rate fell by 5% from the previous year.
Note: All dollar amounts are given in USD.